Our Sustainability Metrics

Carbon Footprint

This metric quantifies the total greenhouse gas emissions (typically expressed in CO2e) generated by the University of Lagos community — covering direct emissions (from campus buildings, vehicles, energy use) and indirect emissions (such as procurement, waste disposal, outsourced services). Tracking carbon footprint enables the Green Hub to identify high-impact activities, set reduction targets, and monitor progress towards climate neutrality. It also supports transparent reporting and demonstrates leadership in campus sustainability.

Waste Management

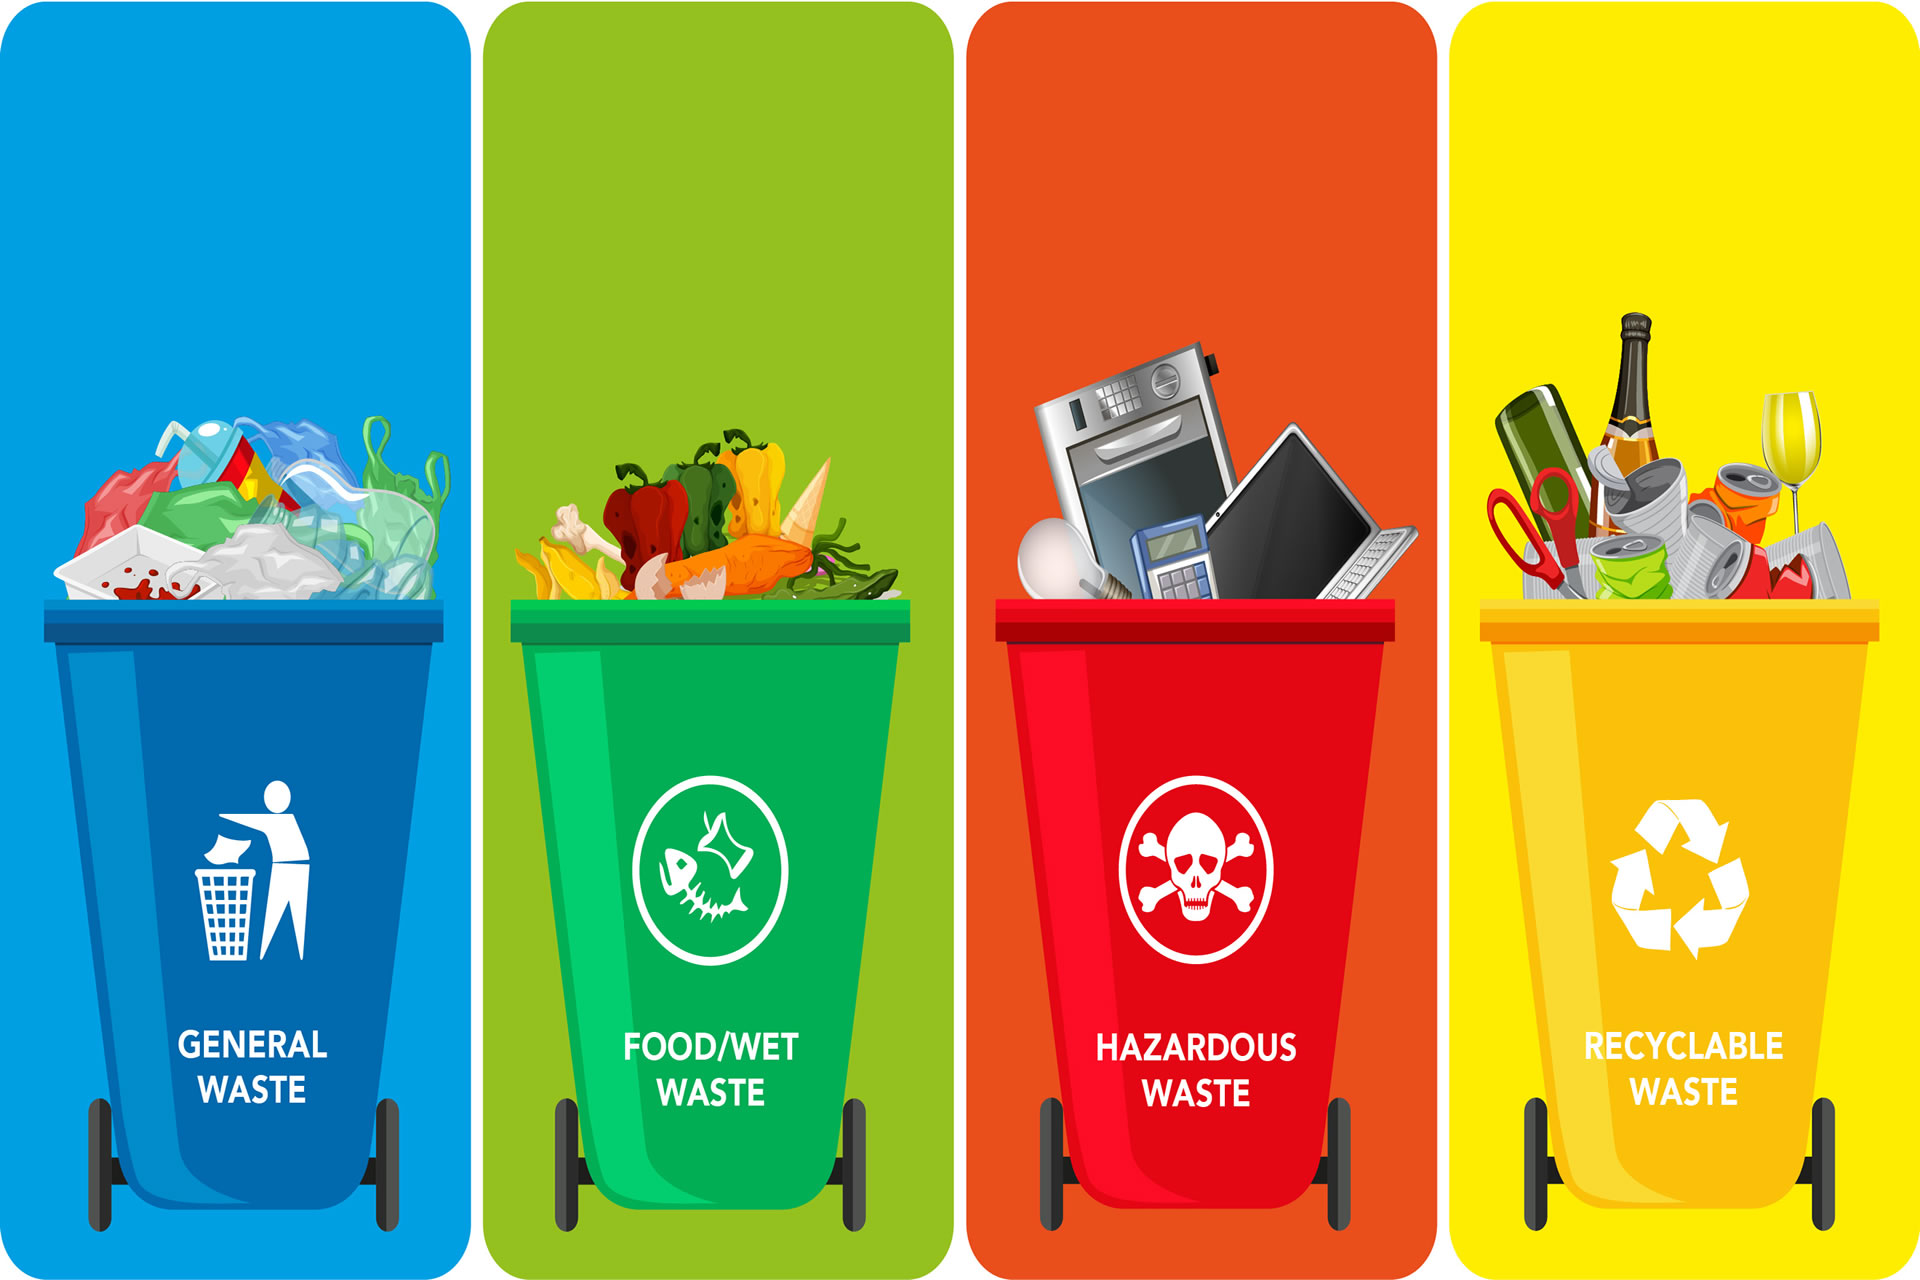
This metric refers to the generation, handling, and diversion of waste (organic, inorganic, hazardous, construction) on campus. It tracks volumes of waste produced, the percentages recycled, reused or safely disposed, and the implementation of zero-waste or circular-economy practices. This data provide the information about the effective waste management system, reflects a shift from “throw-away” to resource recovery, reducing environmental impact, engaging the student body in recycling/upcycling (e.g., the up-cycling challenge), and aligning with circular economy goals.

Water Usage

This metric covers the quantity of water consumed (potable and non‐potable) within campus operations, and the extent to which water efficiency, reuse and recycling are applied. It may include litres per person or per m², or reuse percentages of wastewater or rainwater. Green Hub, monitoring of water usage helps identify losses, support efficient fixtures, rainwater harvesting, grey-water reuse, and protect Lagos’s precious urban water resources in a climate-sensitive setting.

Community Engagement and Education

This metric evaluates how actively the campus community (students, staff, partners, local stakeholders) are involved in sustainability learning, outreach, behaviour change and decision-making. It will track numbers of workshops, participation rates, student projects, partnerships and awareness campaigns. For Unilag’s Green Hub, this metric is central: mobilising youth, informal waste collectors, local recycling actors, conducting trainings and engaging in community-led initiatives ensures sustainability is not just operational but inclusive and transformational.

Sustainable Buildings

This metric relates to the design, construction and operation of campus buildings in ways that minimise environmental footprint and maximise occupant health and productivity. Indicators may include energy and water performance, material use, indoor air quality, daylighting, and certification to green‐building standards. The Green Hub datagathering initiative will supports the retro-fitting or future construction of sustainable buildings on campus—ensuring that the built environment aligns with circular economy, waste-to-resource or low-carbon goals.

Transportation

This metric looks at how people and goods move to, within and from the campus: type and number of vehicles, public transit use, cycle/walk infrastructure, shuttle services, and proportion of low-carbon/zero-emission transport. Monitoring of this data strengthening sustainable transportation (car-pooling, e-shuttles, bike racks, pedestrian zones) reduces emissions, eases congestion, and models behaviour for the wider university and Lagos community.

Biodiversity and Green Spaces

This metric captures the extent, quality and connectivity of green areas on campus (trees, vegetation cover, habitats for native species, landscaping for water absorption), and integration of biodiversity considerations into campus planning. It will include percentage of open green space, number of planted trees, habitat restoration efforts. Within the Green Hub spatial context, increasing green spaces and supporting campus biodiversity (for example through native plantings, pollinator gardens, natural landscaping) enriches ecosystem services, supports climate resilience, and enhances the aesthetics and wellbeing of the university community.

Energy Consumption and Efficiency

This metric captures how much energy is used across university operations (lighting, HVAC, labs, computing) and how efficiently that energy supports activities. It includes indicators such as kWh per m², or energy per occupant, as well as how much energy is wasted or optimised. The Green Hub, monitoring of overall reduction in energy use and improving efficiency (for example via smart controls, efficient equipment, renewable sources) provide a data base to lower costs, fewer emissions and a more resilient campus.